Skip to main content
Most engineering teams already rely on carefully curated metric dashboards to monitor system health and debug production issues. In Relvy, you can surface these dashboards explicitly so the platform understands which ones are critical for debugging and incident response.
Why This Matters
Dashboards selected in this section help Relvy:
- Understand which metrics and visualizations are most important to your team
- Automatically ingest relevant metrics during incidents, including resolving template variables like services, regions, and environments
- Align the debugging workflow with how your team already operates
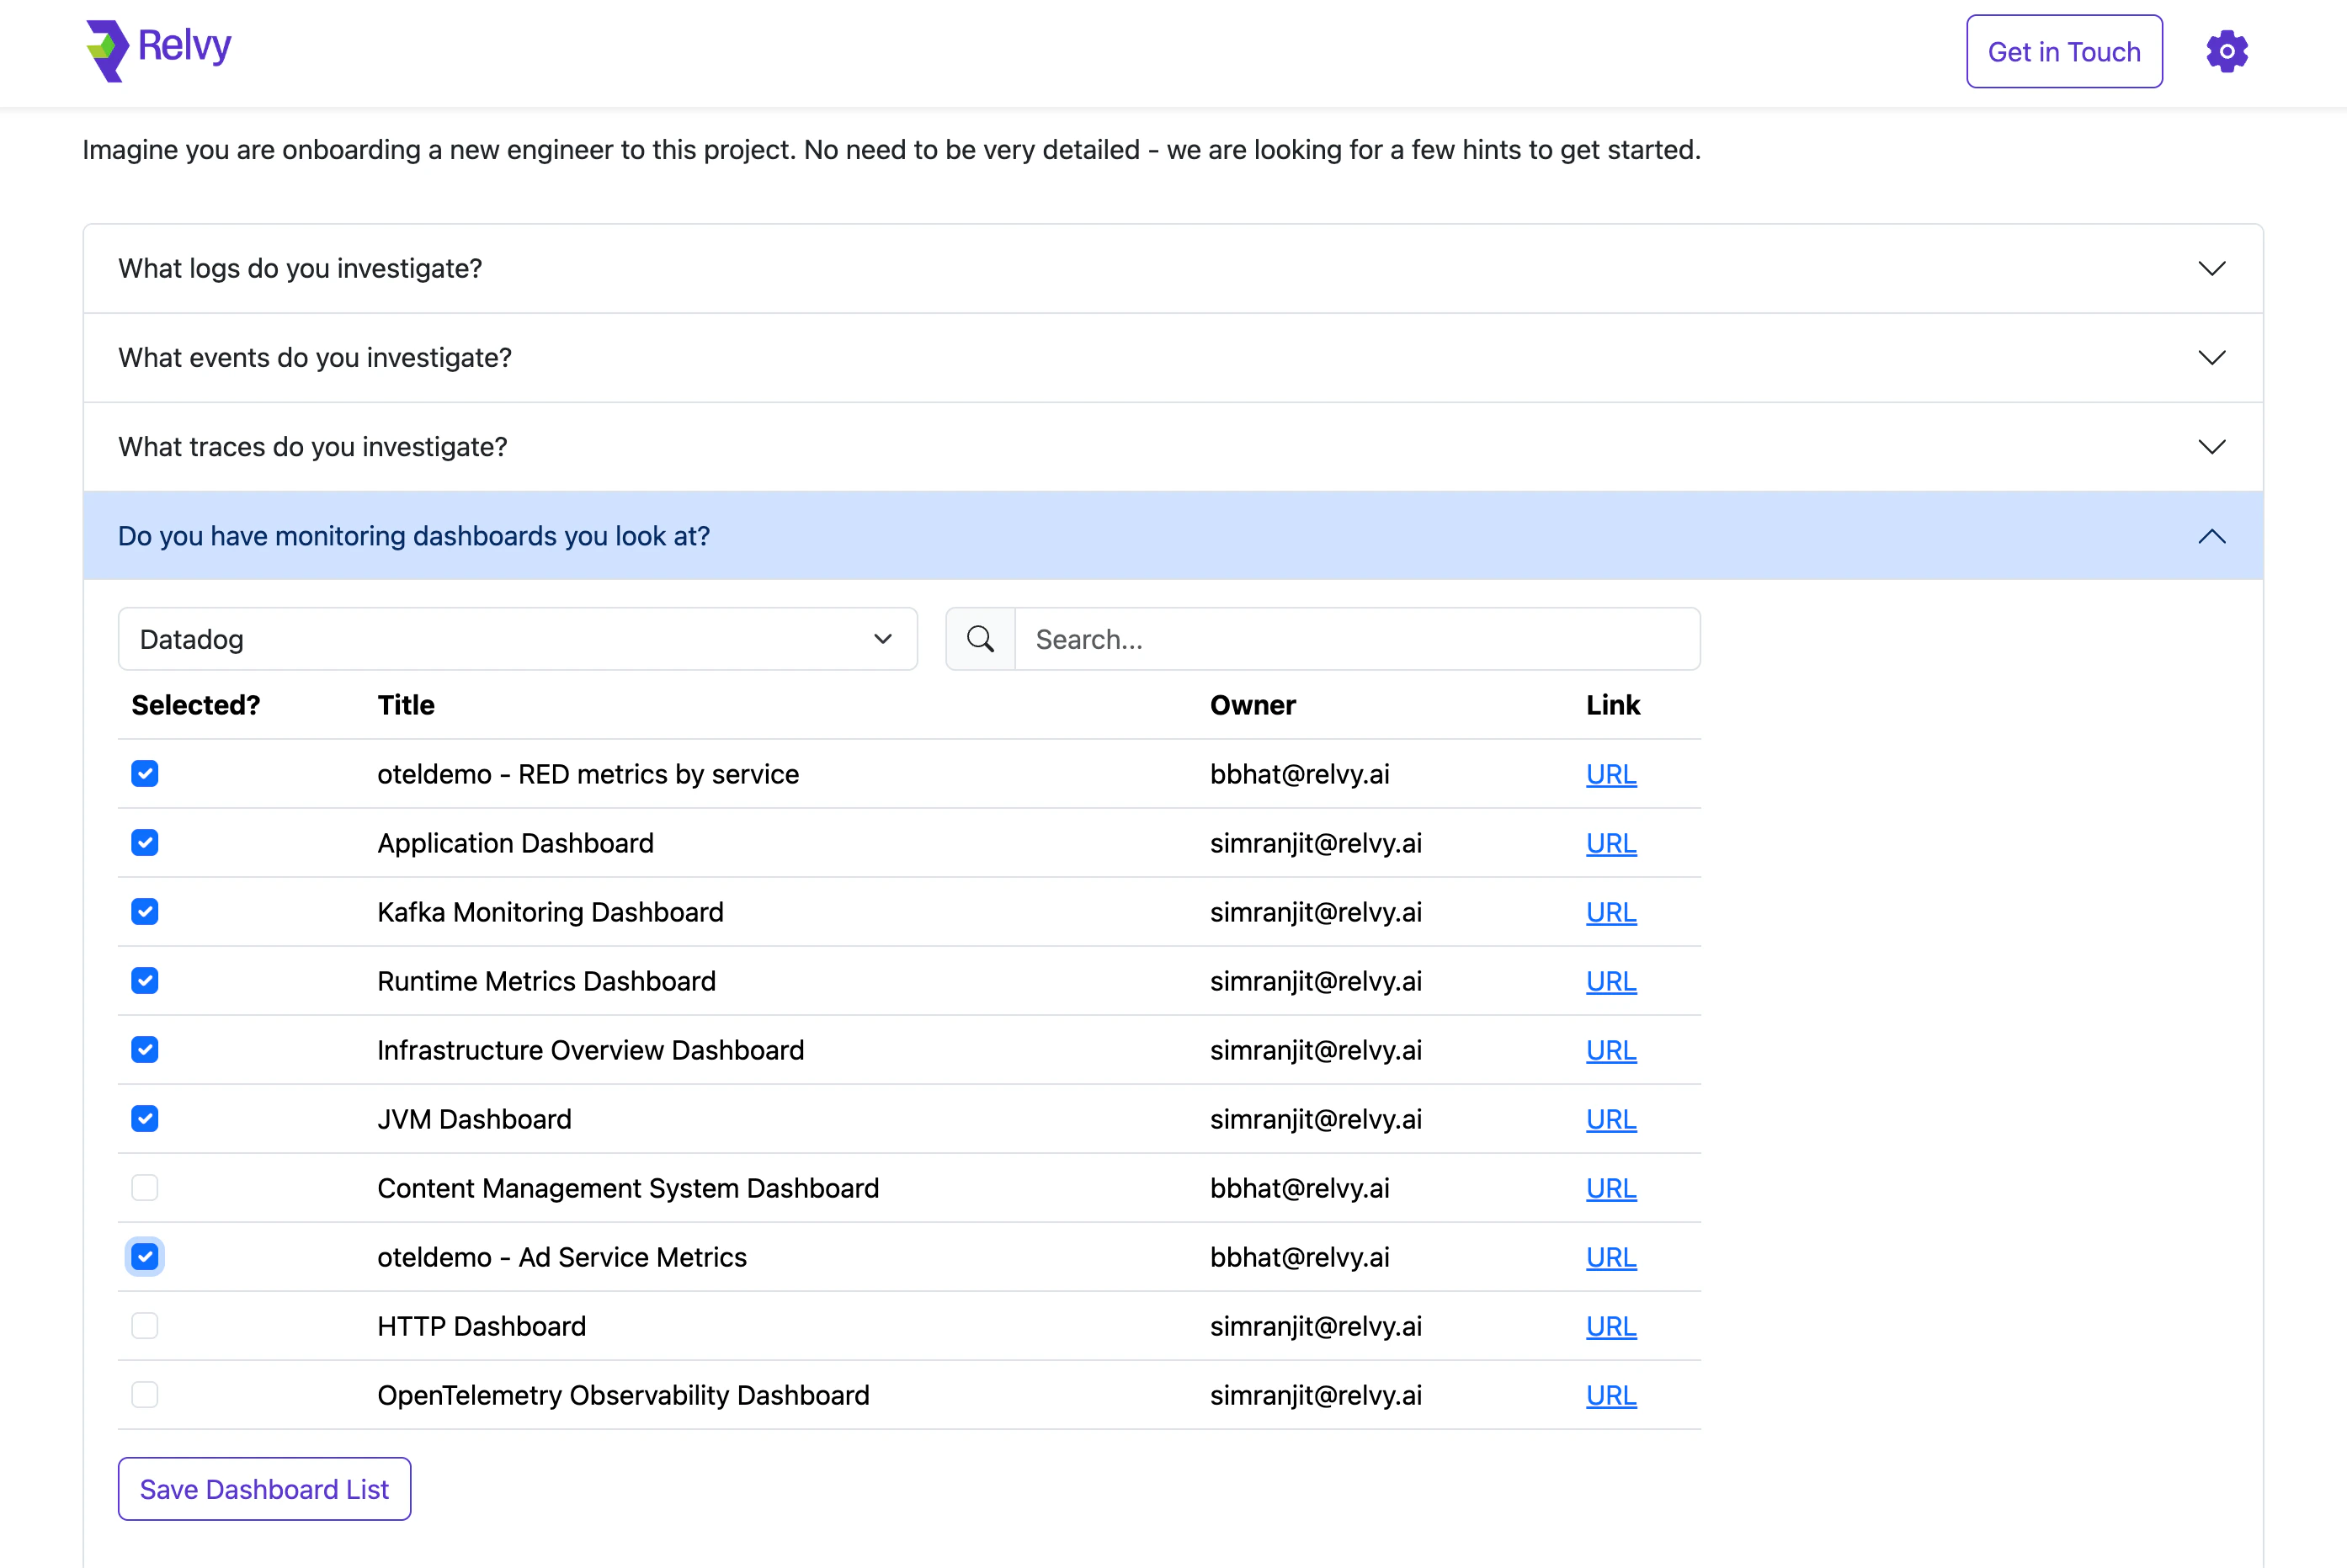
Select Relevant Dashboards from Datadog
If you have connected Datadog as your observability backend, Relvy will automatically fetch a list of available dashboards.
To configure:
-
Expand the section titled “Do you have monitoring dashboards you look at?”
-
Choose Datadog from the data provider dropdown.
-
A searchable list of your existing Datadog dashboards will appear.
-
From this list:
- Select dashboards that are critical to your team’s incident response.
- These may include service-level dashboards, infrastructure overviews, SLO dashboards, or RED metrics dashboards.
- You can filter dashboards by name or owner using the search bar.
-
Review your selections, then click Save Dashboard List.
 Relvy does not copy or modify your dashboards. Instead, it:
- References them during investigations
- Pulls in live metrics and visualizations from Datadog
- Uses templating context (like selected service or environment) to populate them automatically
Best Practices
When selecting dashboards:
- Focus on those used during on-call or incident review
- Include dashboards that cover:
- Key business services
- Infrastructure components (e.g., databases, Kubernetes nodes)
- Application performance metrics (e.g., error rate, latency, traffic)
With dashboards configured, Relvy integrates seamlessly into your existing observability workflow — turning your current monitoring setup into a powerful debugging assistant.