Skip to main content
Relvy structures its debugging around the concept of datasets. A dataset defines a focused scope of data — such as logs, events, or traces — that Relvy queries from your connected observability backends (like Datadog).
By configuring datasets, you’re telling Relvy:
- What type of data to query (logs, spans, events)
- Which subset of that data is relevant (using queries)
- Which provider and environment the data belongs to
In this step, you’ll configure datasets across three observability signals: Logs, Events, and Traces.
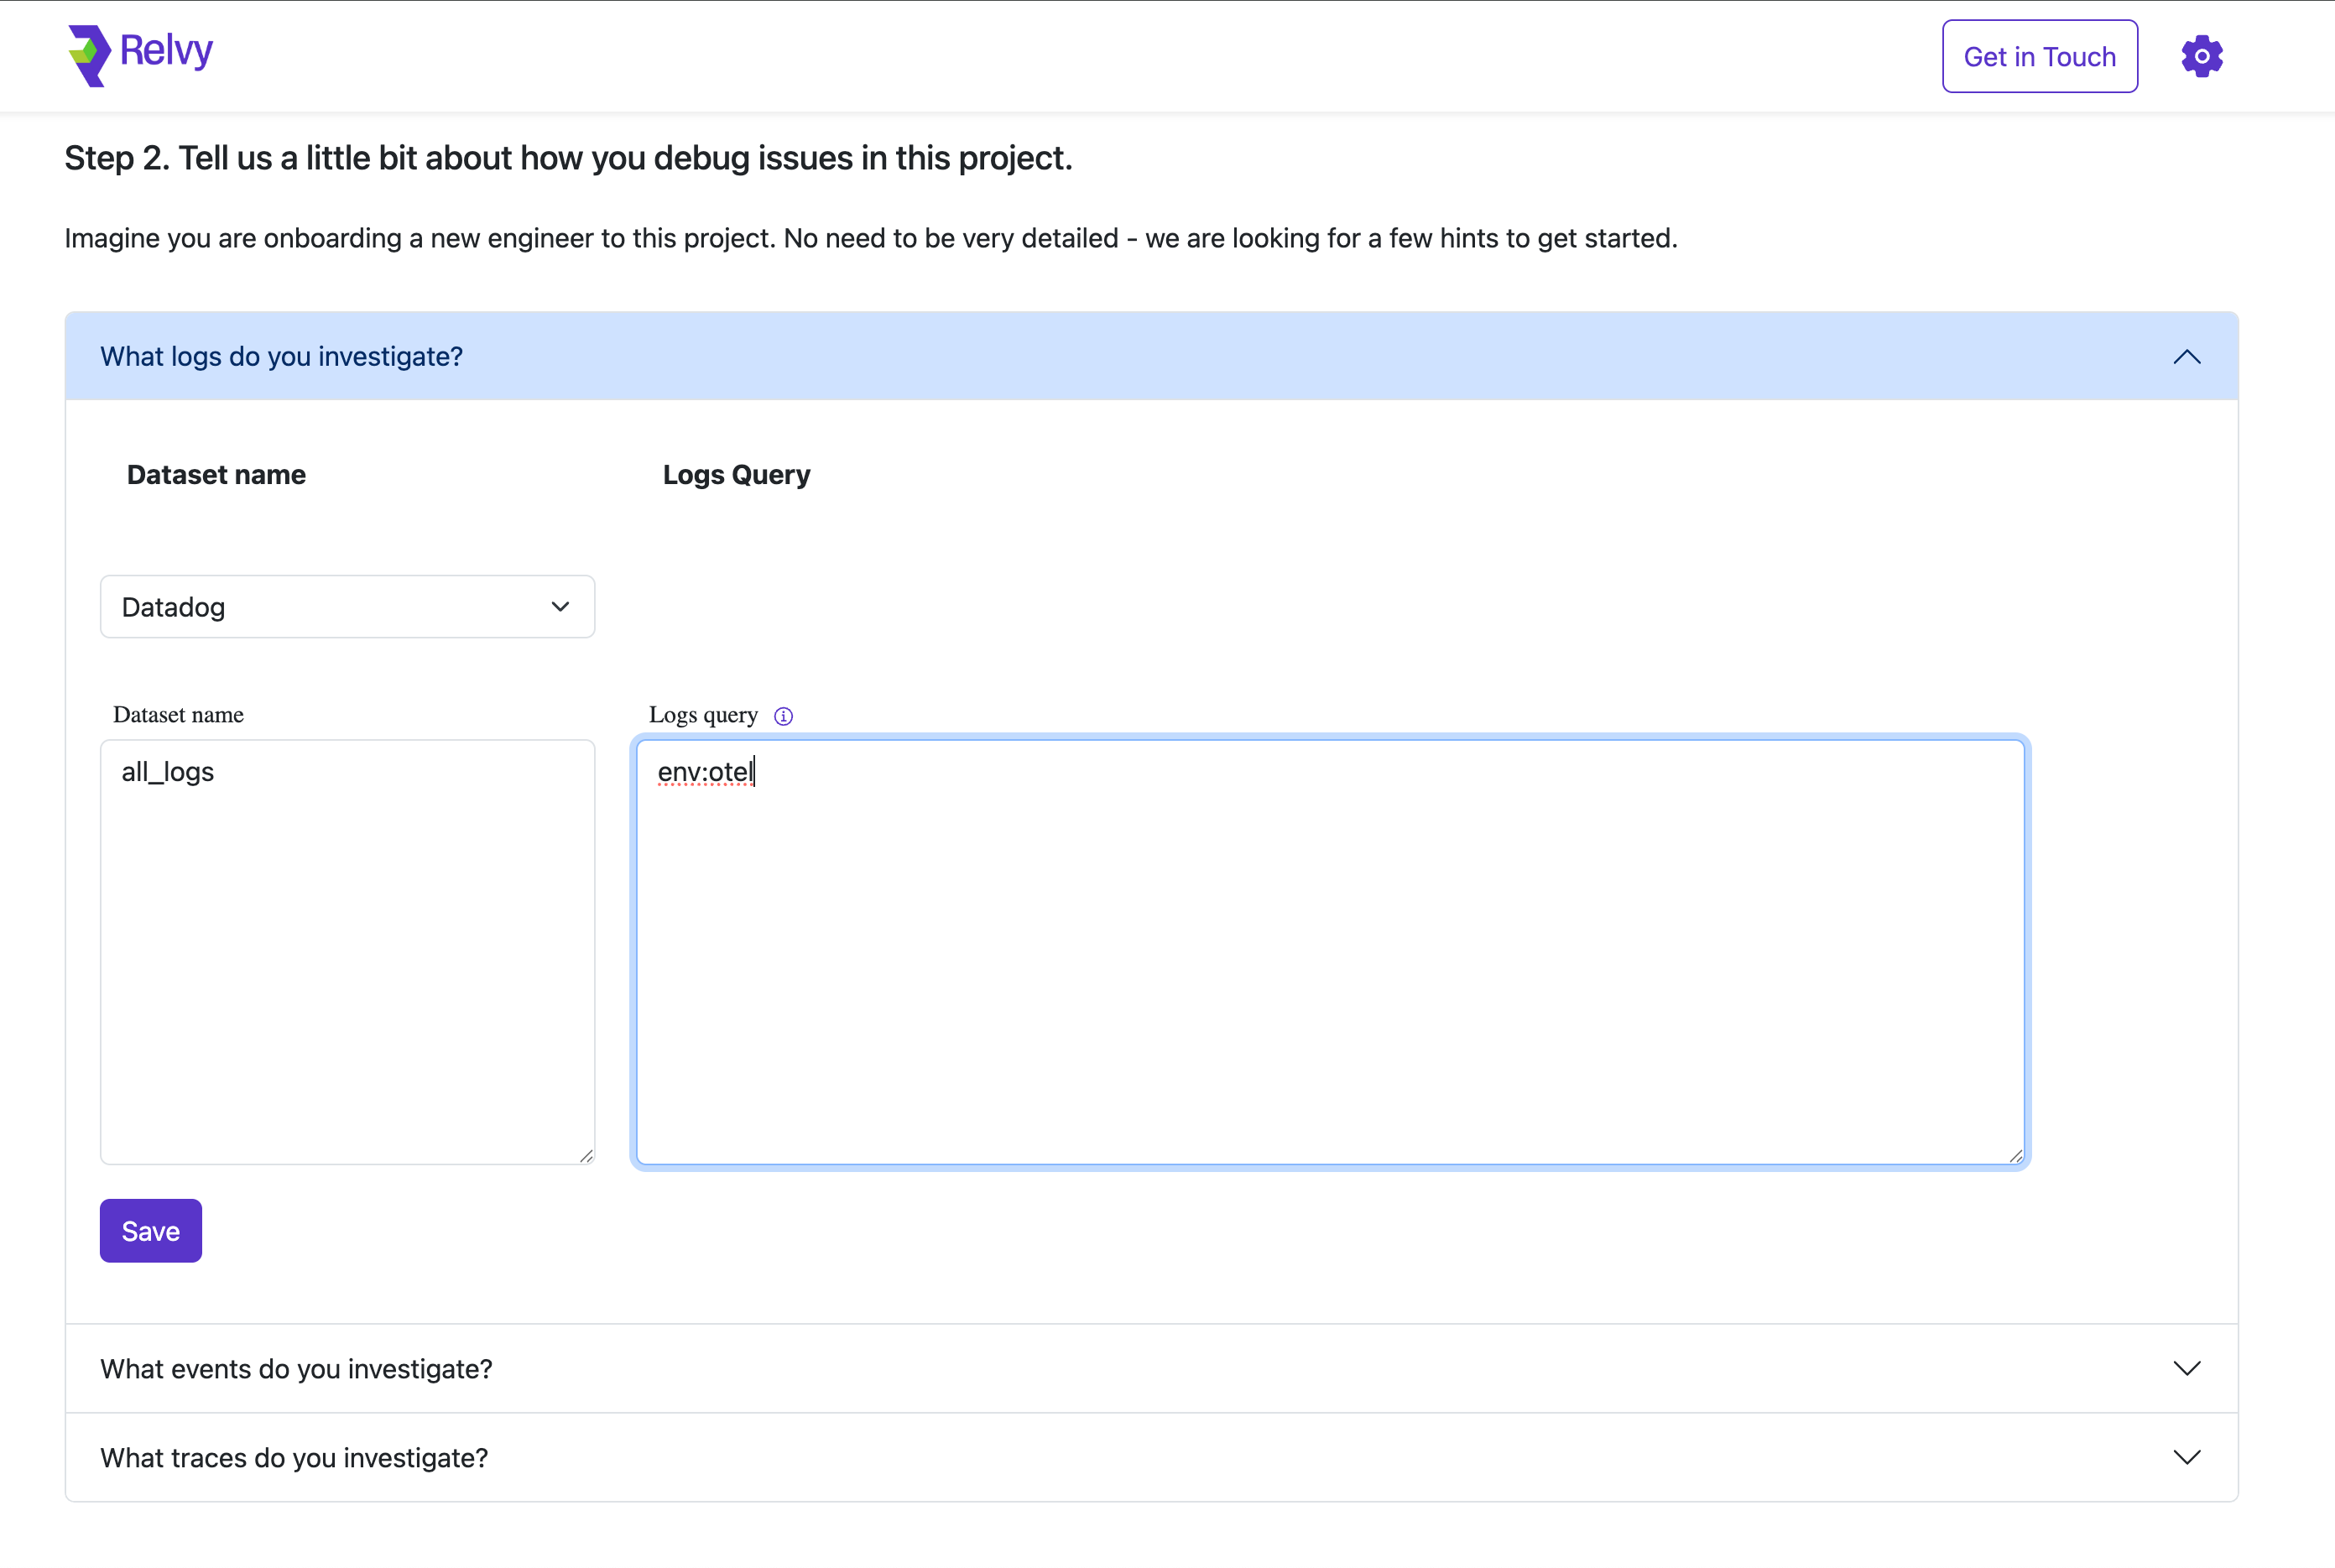
Logs are a critical part of debugging — they provide granular, timestamped context about what’s happening in your services. To configure a logs dataset:
-
Expand the section titled “What logs do you investigate?”
-
Select Data Source, Datadog in this example.
-
Fill in the following fields:
- Dataset Name: Choose a name that describes the dataset’s purpose (e.g., application_logs, security_logs).
- Logs Query: Provide a query that filters relevant logs from your observability backend. This query should isolate logs typically used during investigations (e.g., environment-specific logs or service-level logs).
-
Click Save to finalize the configuration.
 Once saved, the dataset will appear in your list of configured datasets. You can create multiple logs datasets to match different investigation patterns - for example:
- One dataset for frontend application logs
- Another for backend service logs
- A dedicated dataset for security-related logs
- Environment-specific datasets (prod vs staging)
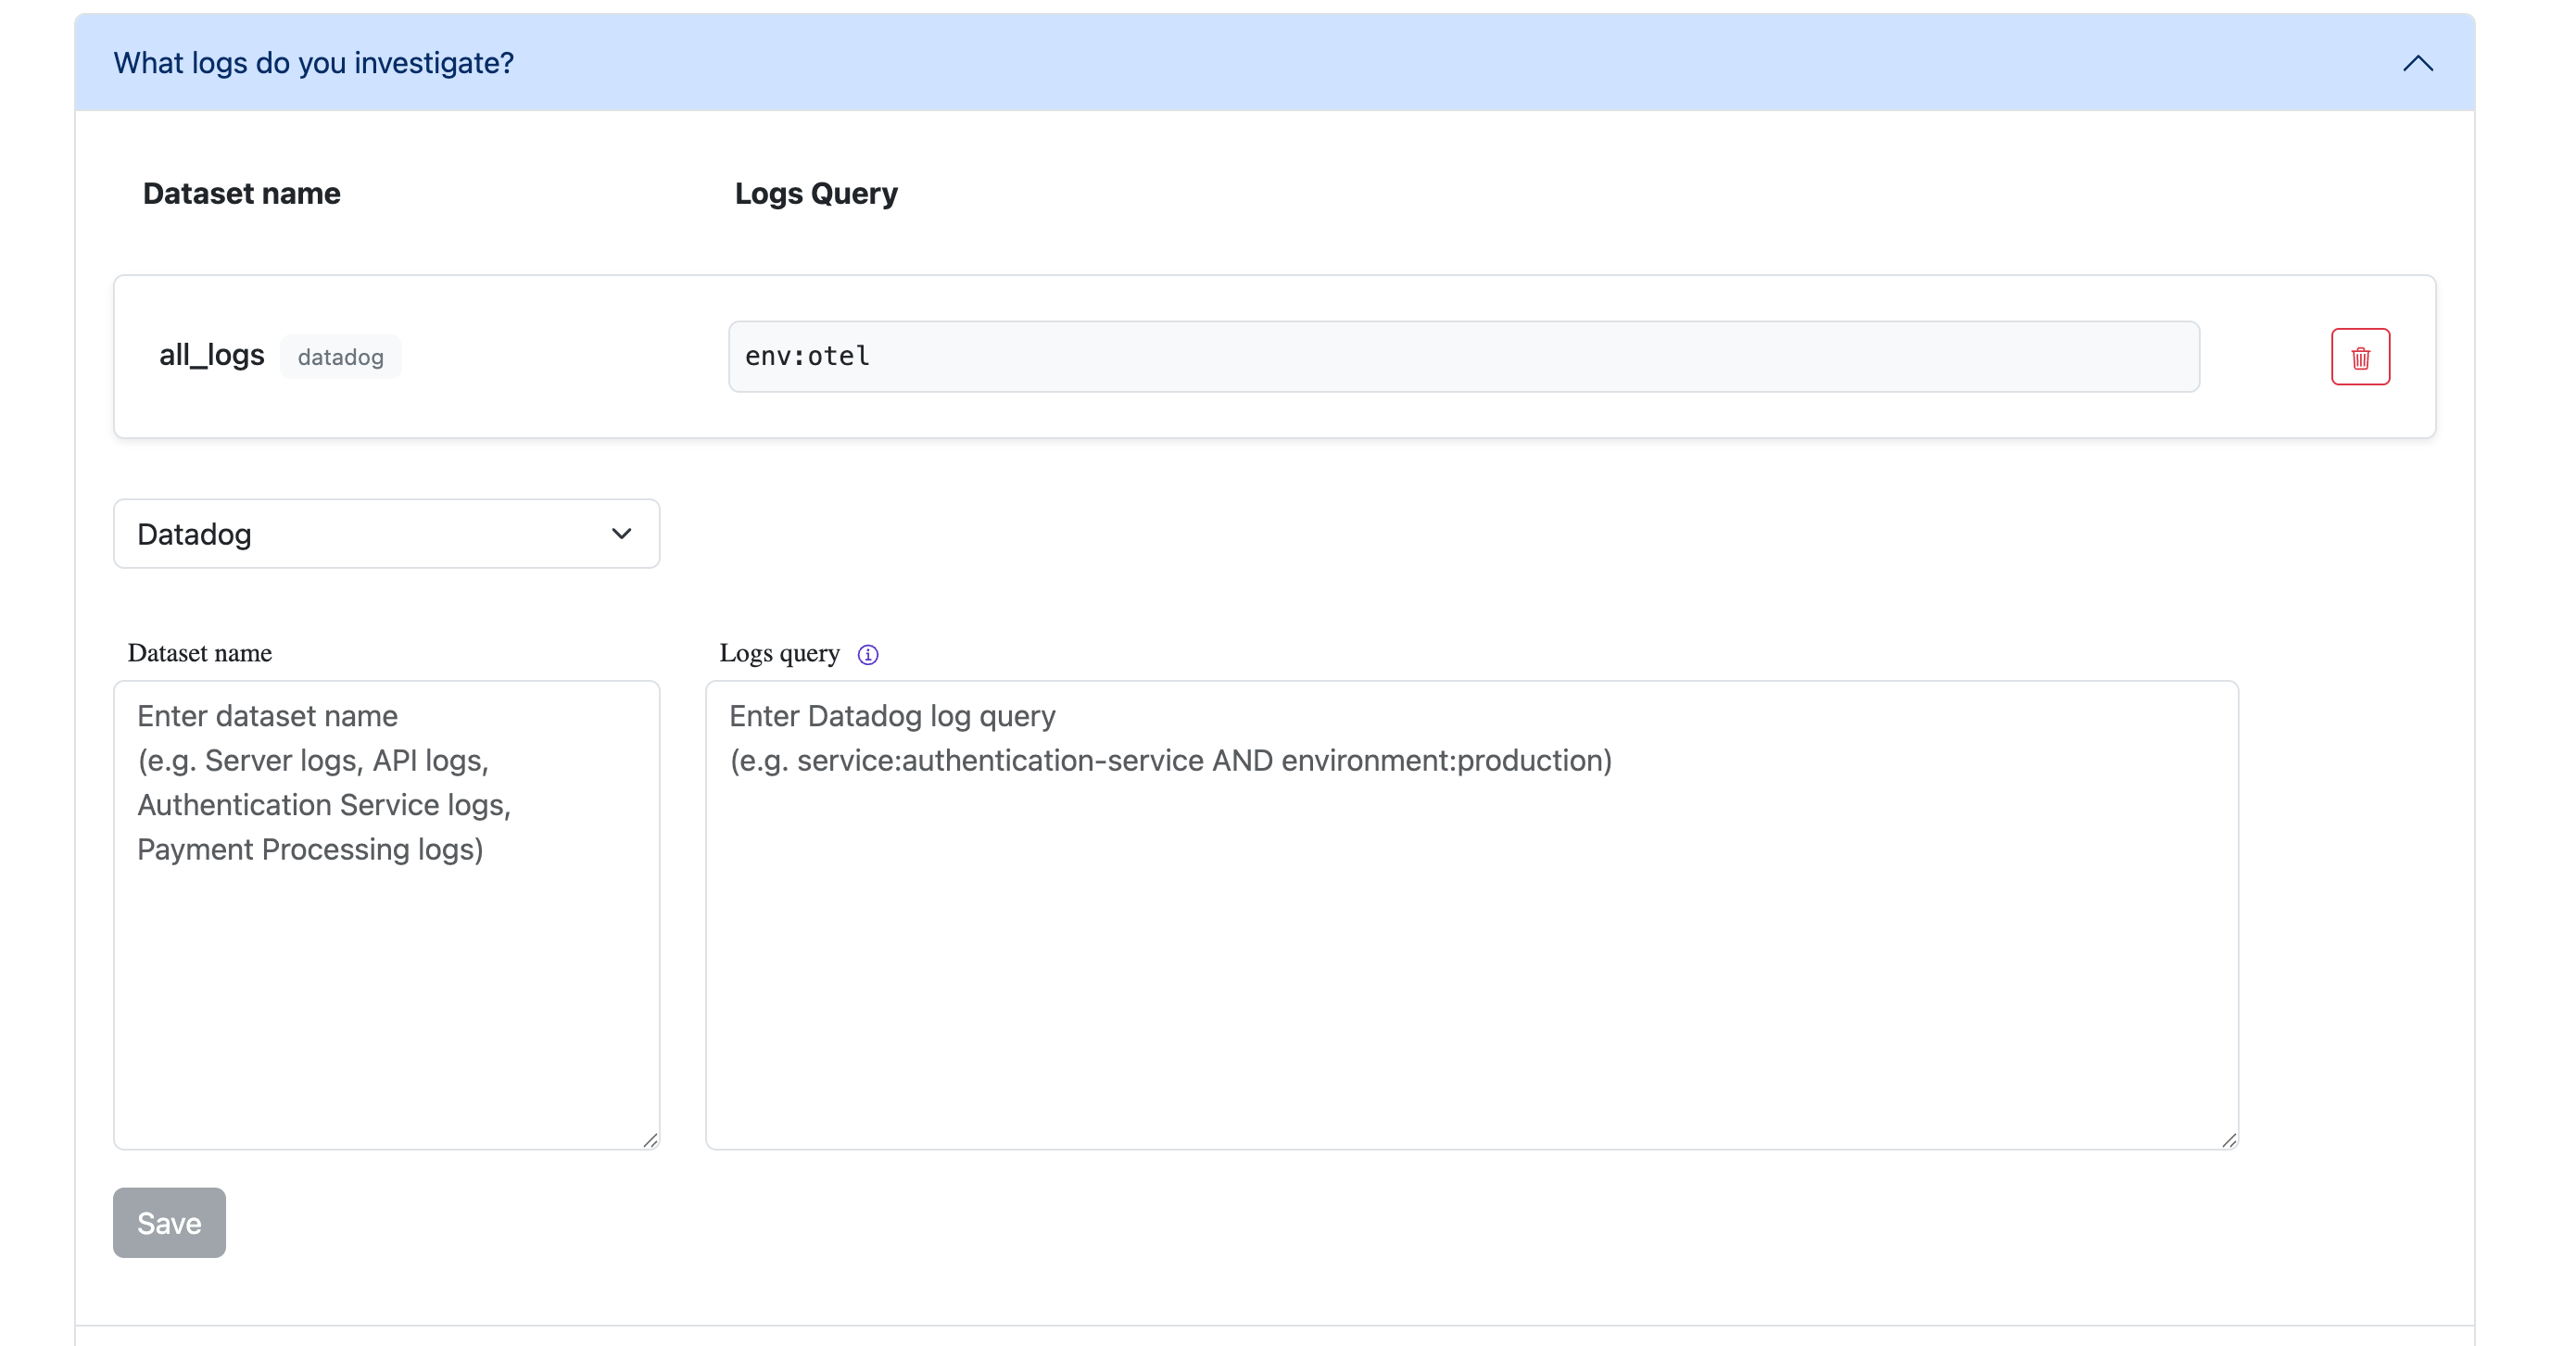 This flexibility allows you to organize and scope your log data in ways that match your team’s debugging workflows.
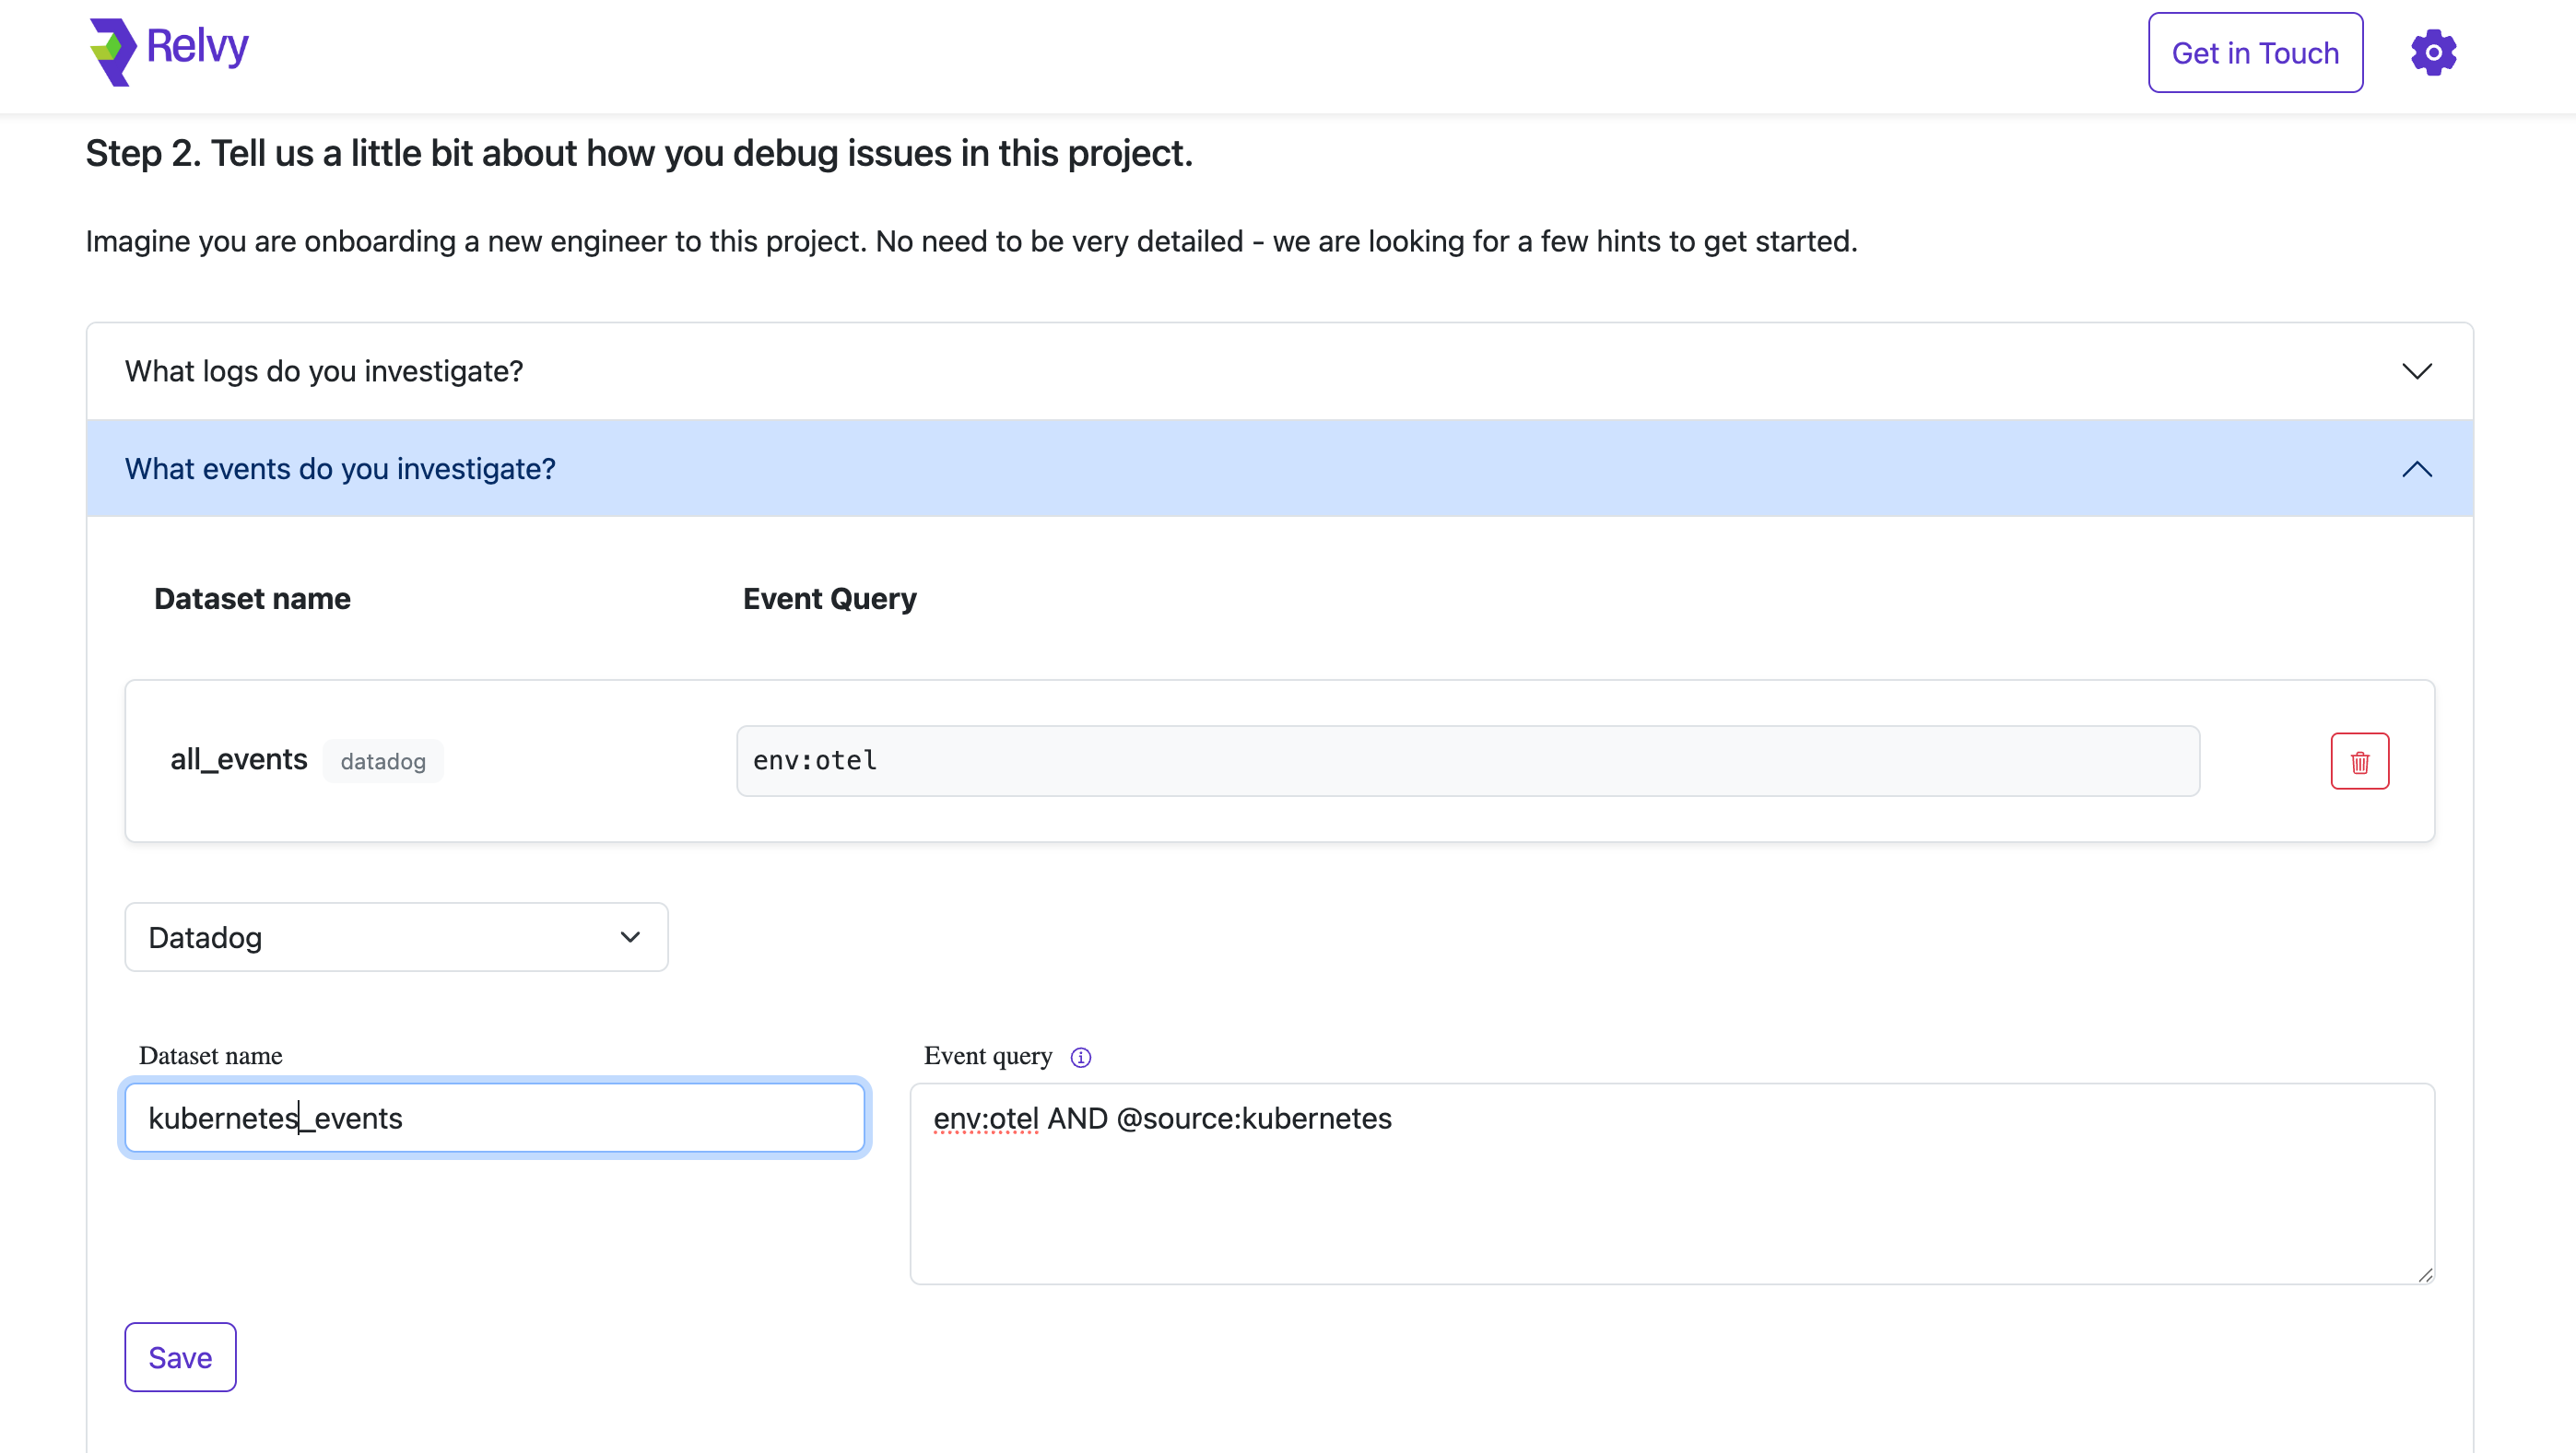
Events provide higher-level signals such as deployments, alerts, infrastructure changes, or custom business events. These are useful for correlation and root-cause analysis.
To set up events datasets:
This flexibility allows you to organize and scope your log data in ways that match your team’s debugging workflows.
Events provide higher-level signals such as deployments, alerts, infrastructure changes, or custom business events. These are useful for correlation and root-cause analysis.
To set up events datasets:
-
Expand the section “What events do you investigate?”
-
Select Data Source, Datadog in this example.
-
Provide:
- Dataset Name: Assign a descriptive label for clarity.
- Event Query: Define a query that isolates the events you’re interested in (e.g., deployment events, Kubernetes events, alert notifications).
-
Click Save for each dataset added.
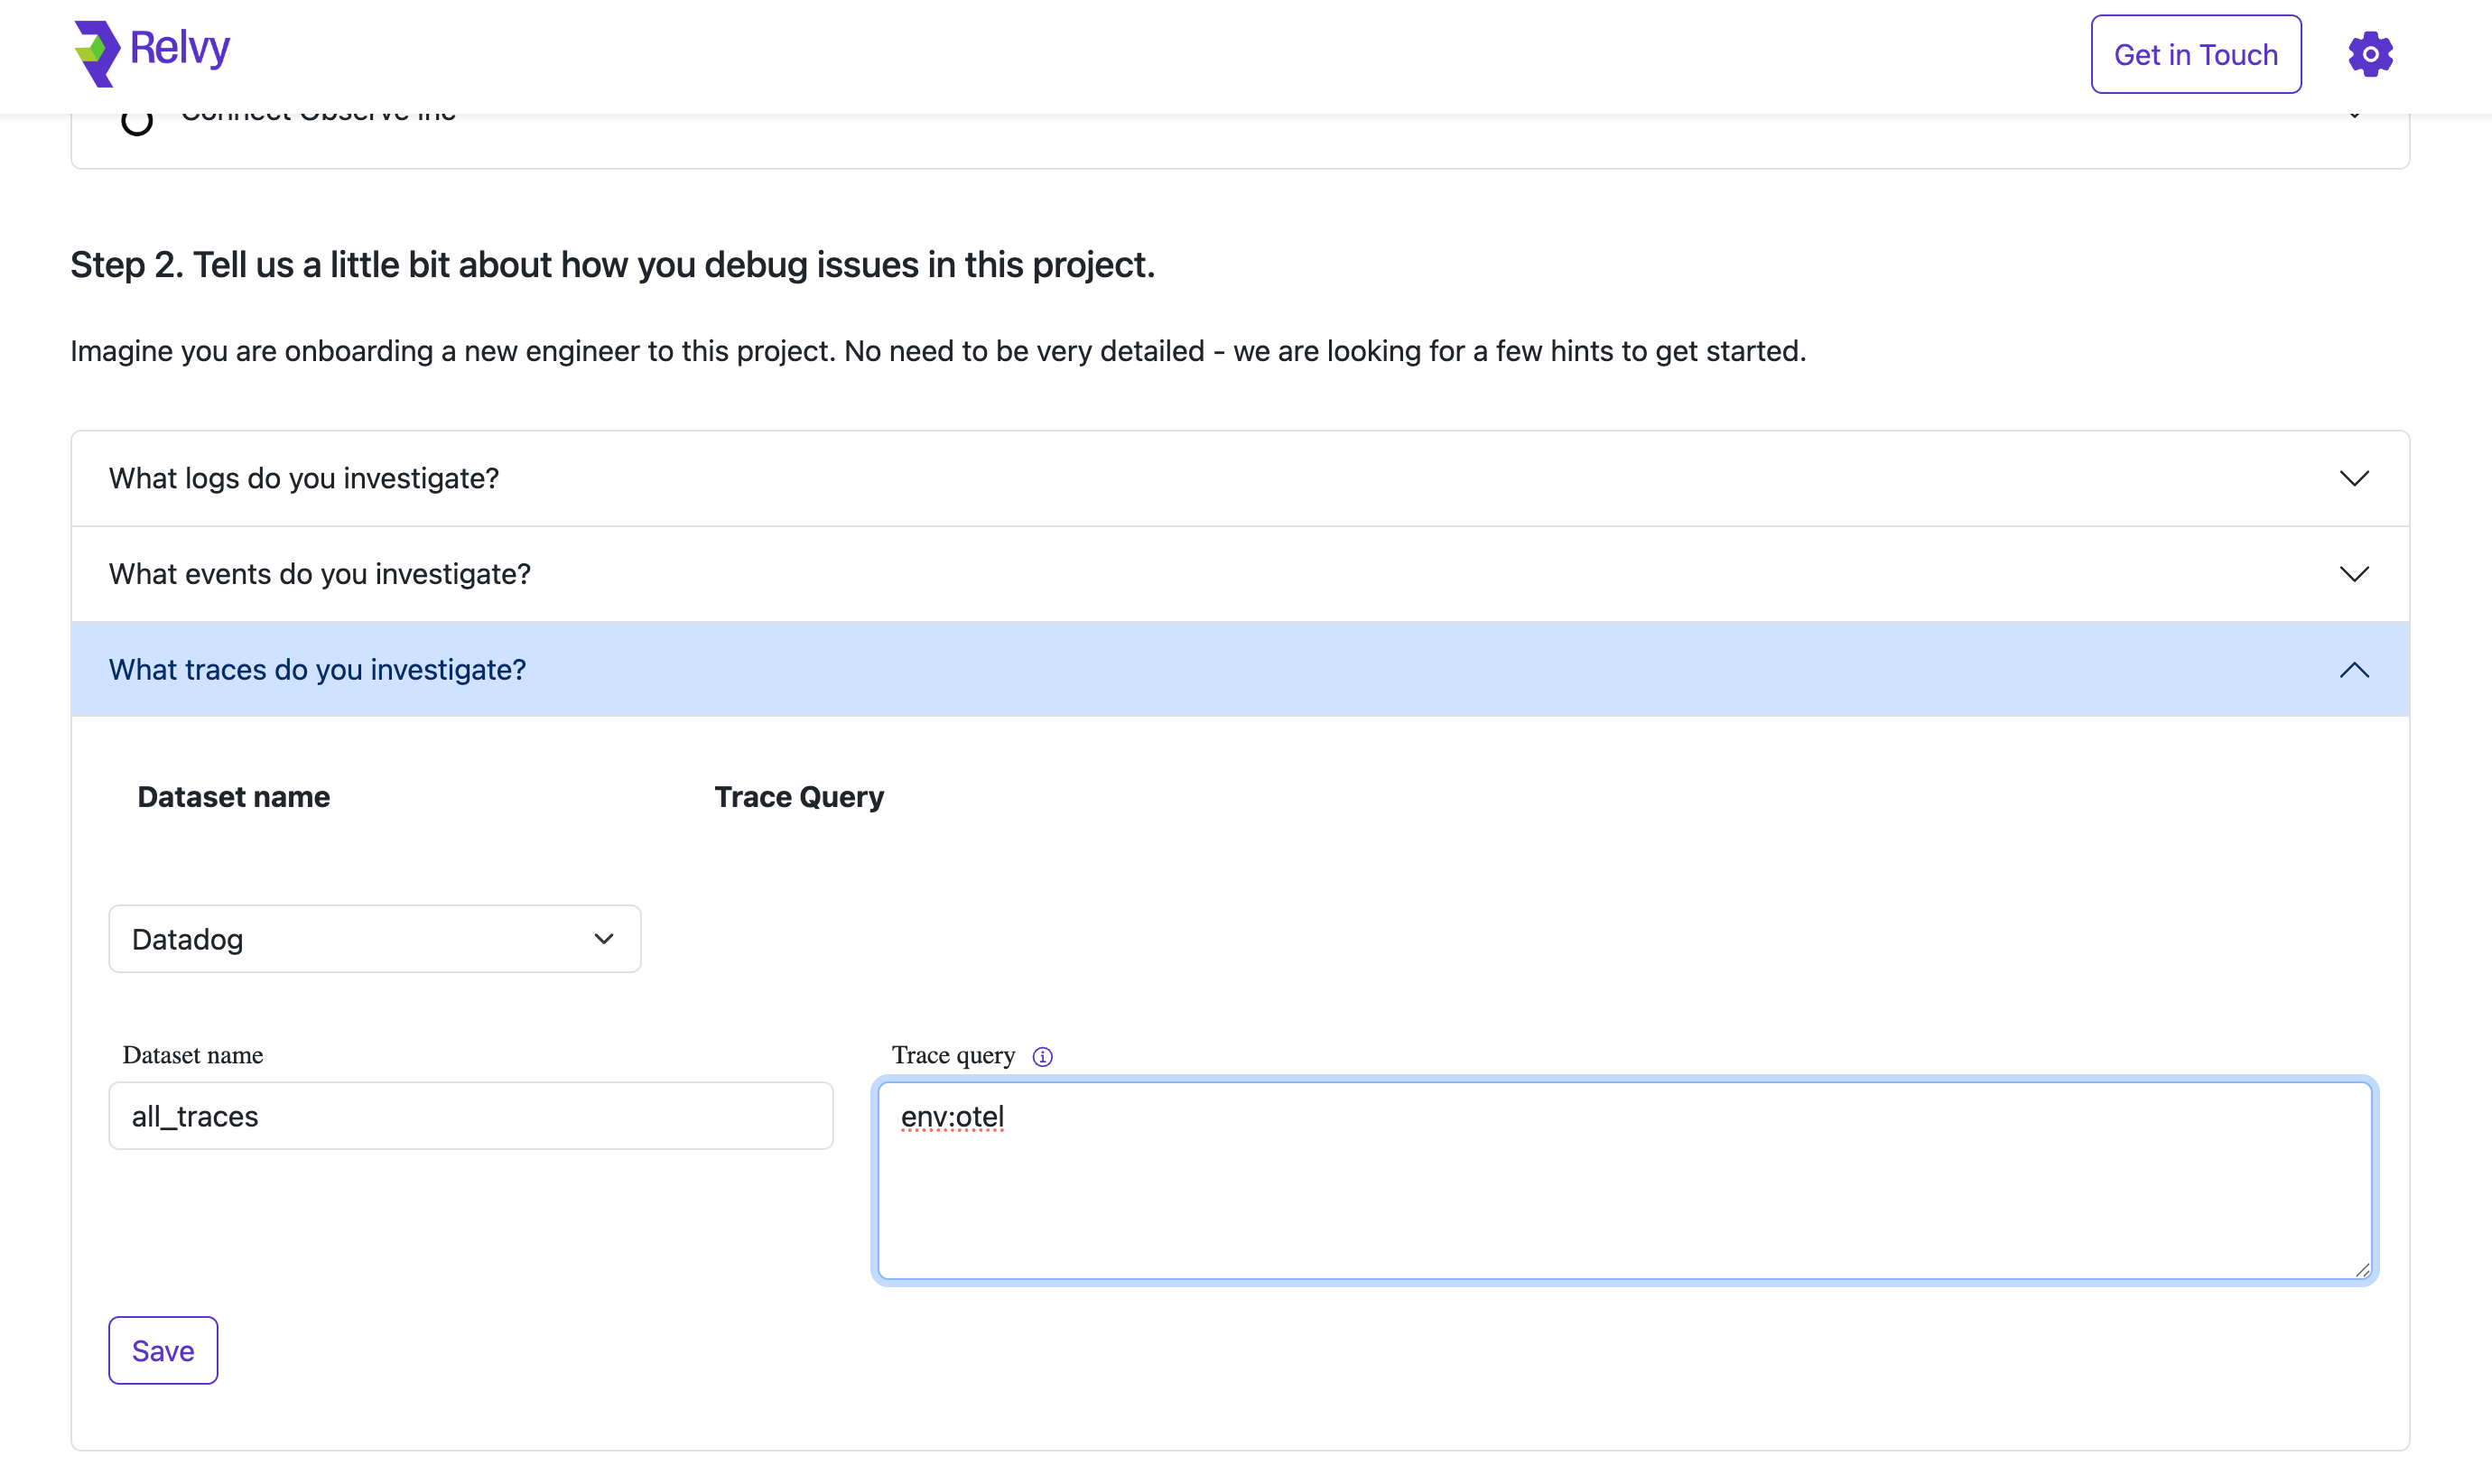
 Traces give visibility into distributed transactions across services, making them essential for understanding latency, dependencies, and service behavior.
To configure trace datasets:
Traces give visibility into distributed transactions across services, making them essential for understanding latency, dependencies, and service behavior.
To configure trace datasets:
-
Expand the section “What traces do you investigate?”
-
Select Data Source, Datadog in this example.
-
Set the following:
- Dataset Name: Use a clear and descriptive name (e.g., all_traces, checkout_flows).
- Trace Query: Provide a trace query that returns spans relevant to your investigations. This may focus on certain services, environments, or request types.
-
Click Save to confirm.
Why This Matters
Each dataset you define tailors how Relvy:
- Collects and filters data from your observability provider
- Provides context-specific suggestions during incidents
Properly scoping your datasets ensures Relvy surfaces the most relevant signals when it matters most, without overwhelming users with unrelated data.