Create AI Instruction Sets to Guide Automated Debugging
AI Instruction sets are the main mechanism to guide the behavior of Relvy’s AI agent during real-time incident analysis. When incidents occur, Relvy’s AI-based investigation engine uses your instructions to plan and execute the debugging process.How AI Instructions Work in Relvy
Relvy’s AI investigation system consists of:- A
Planner, which orchestrates the overall debugging strategy. - Specialized
Data Source Agentsfor logs, metrics (dashboards), events, and traces.
- Reads applicable instructions relevant to the incident symptoms or tags.
- Uses the instructions to prioritize certain signals and tools.
- Dispatches tasks to the data source agents accordingly.
- Aggregates findings into a unified Root Cause Analysis.
Creating AI Instruction sets
There are 3 ways to create AI Instruction sets:- Manually
- Import from existing documentation
- [From Investigations(#from-investigations)
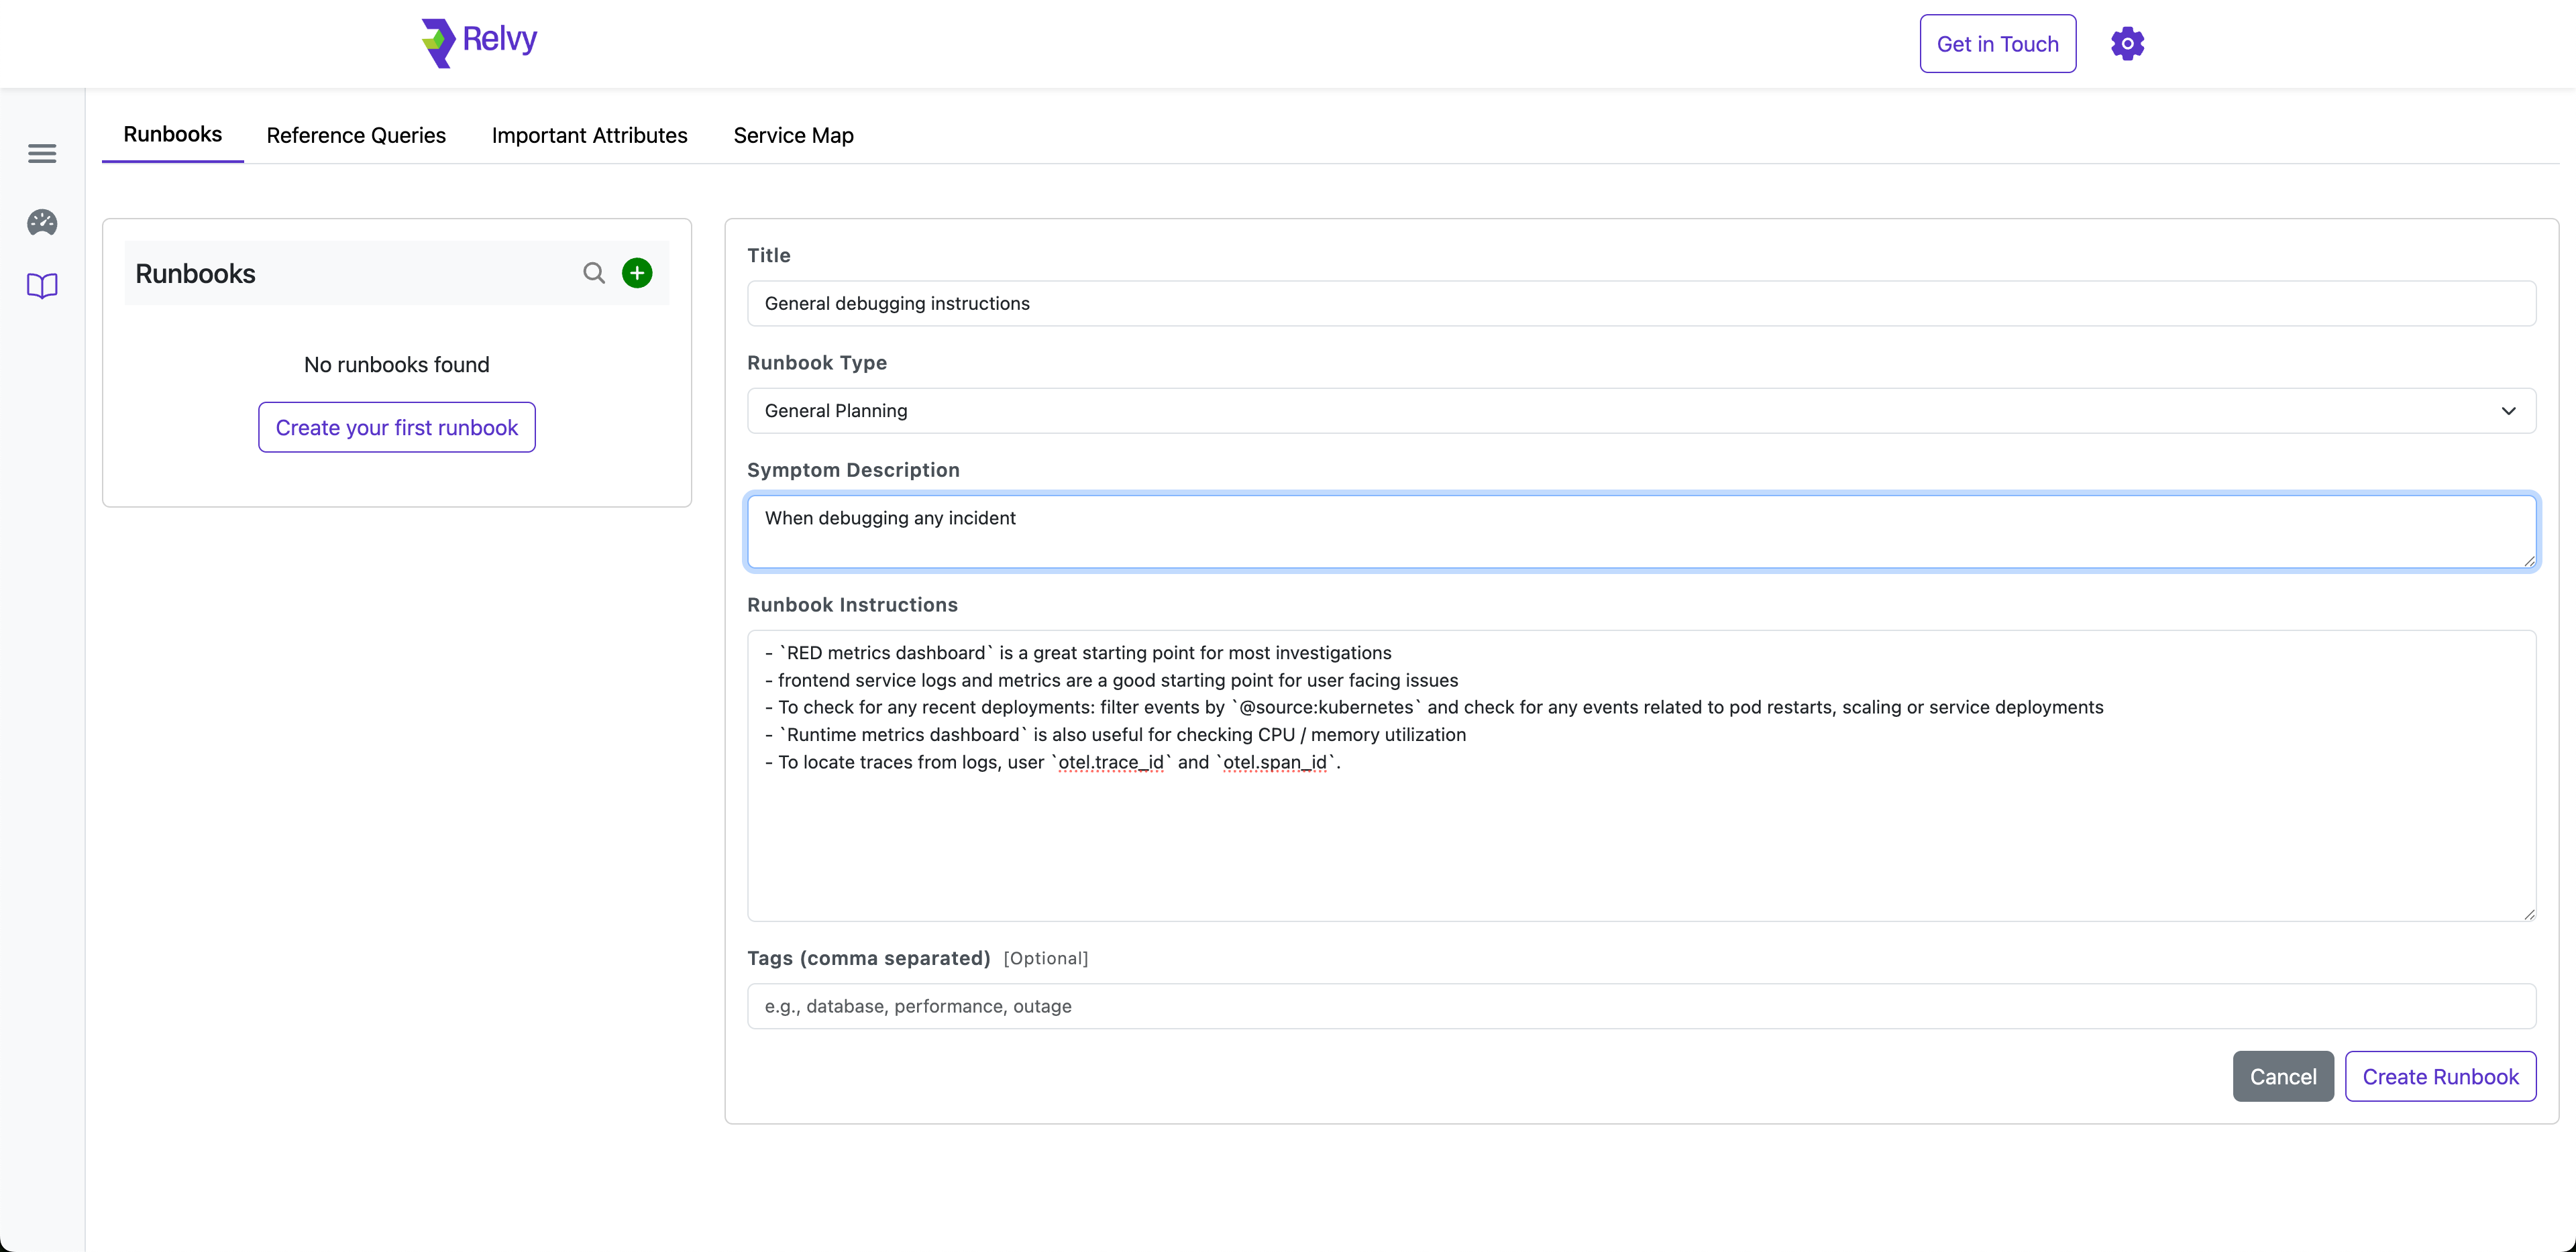
Manual Creation
To add an instruction set:- Navigate to the AI Instruction Sets tab in the Discovery section on the left sidebar.
- Click Create New Instruction Set.
-
Fill out the form:
- Title: A clear and concise label.
- Type: e.g., General Planning, Log Analysis, Event Analysis.
- Symptom / When to Use: Describe when this instruction set is applicable.
- Instructions: Write your investigation steps in natural language.
- Tags (optional): Add tags like user-facing, latency, kubernetes, etc.
- Click Create Instruction Set to save.
Import Existing
Relvy can automatically generate executable AI Instruction sets for you from your existing documentation sources like Atlassian Confluence. We support the following data sources for automatic import of AI Instructions:- Atlassian Confluence
Steps
- Navigate to the AI Instruction Sets tab in the Discovery section on the left sidebar.
-
Click on the ‘Import Runbooks’ icon from the left panel.
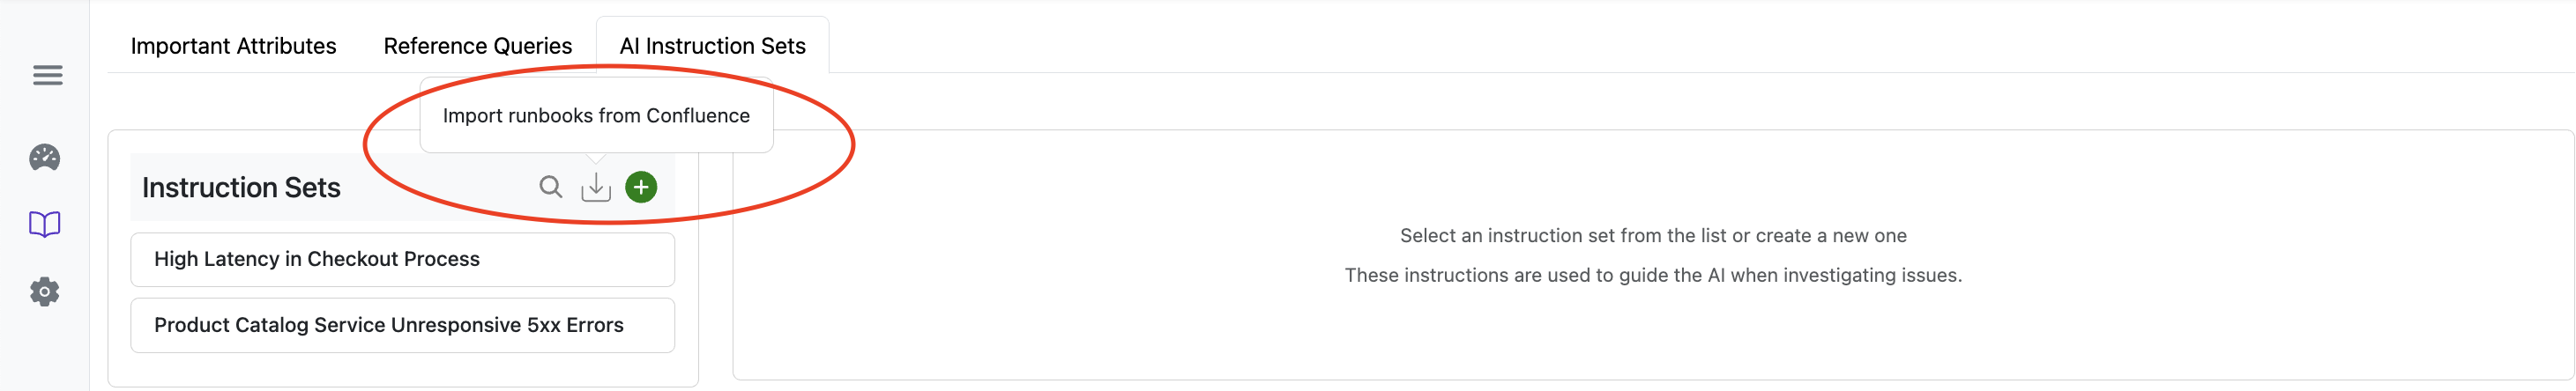
-
Search and select documents that you want to create AI instructions from. These are typically your existing runbooks or postmortem documents.
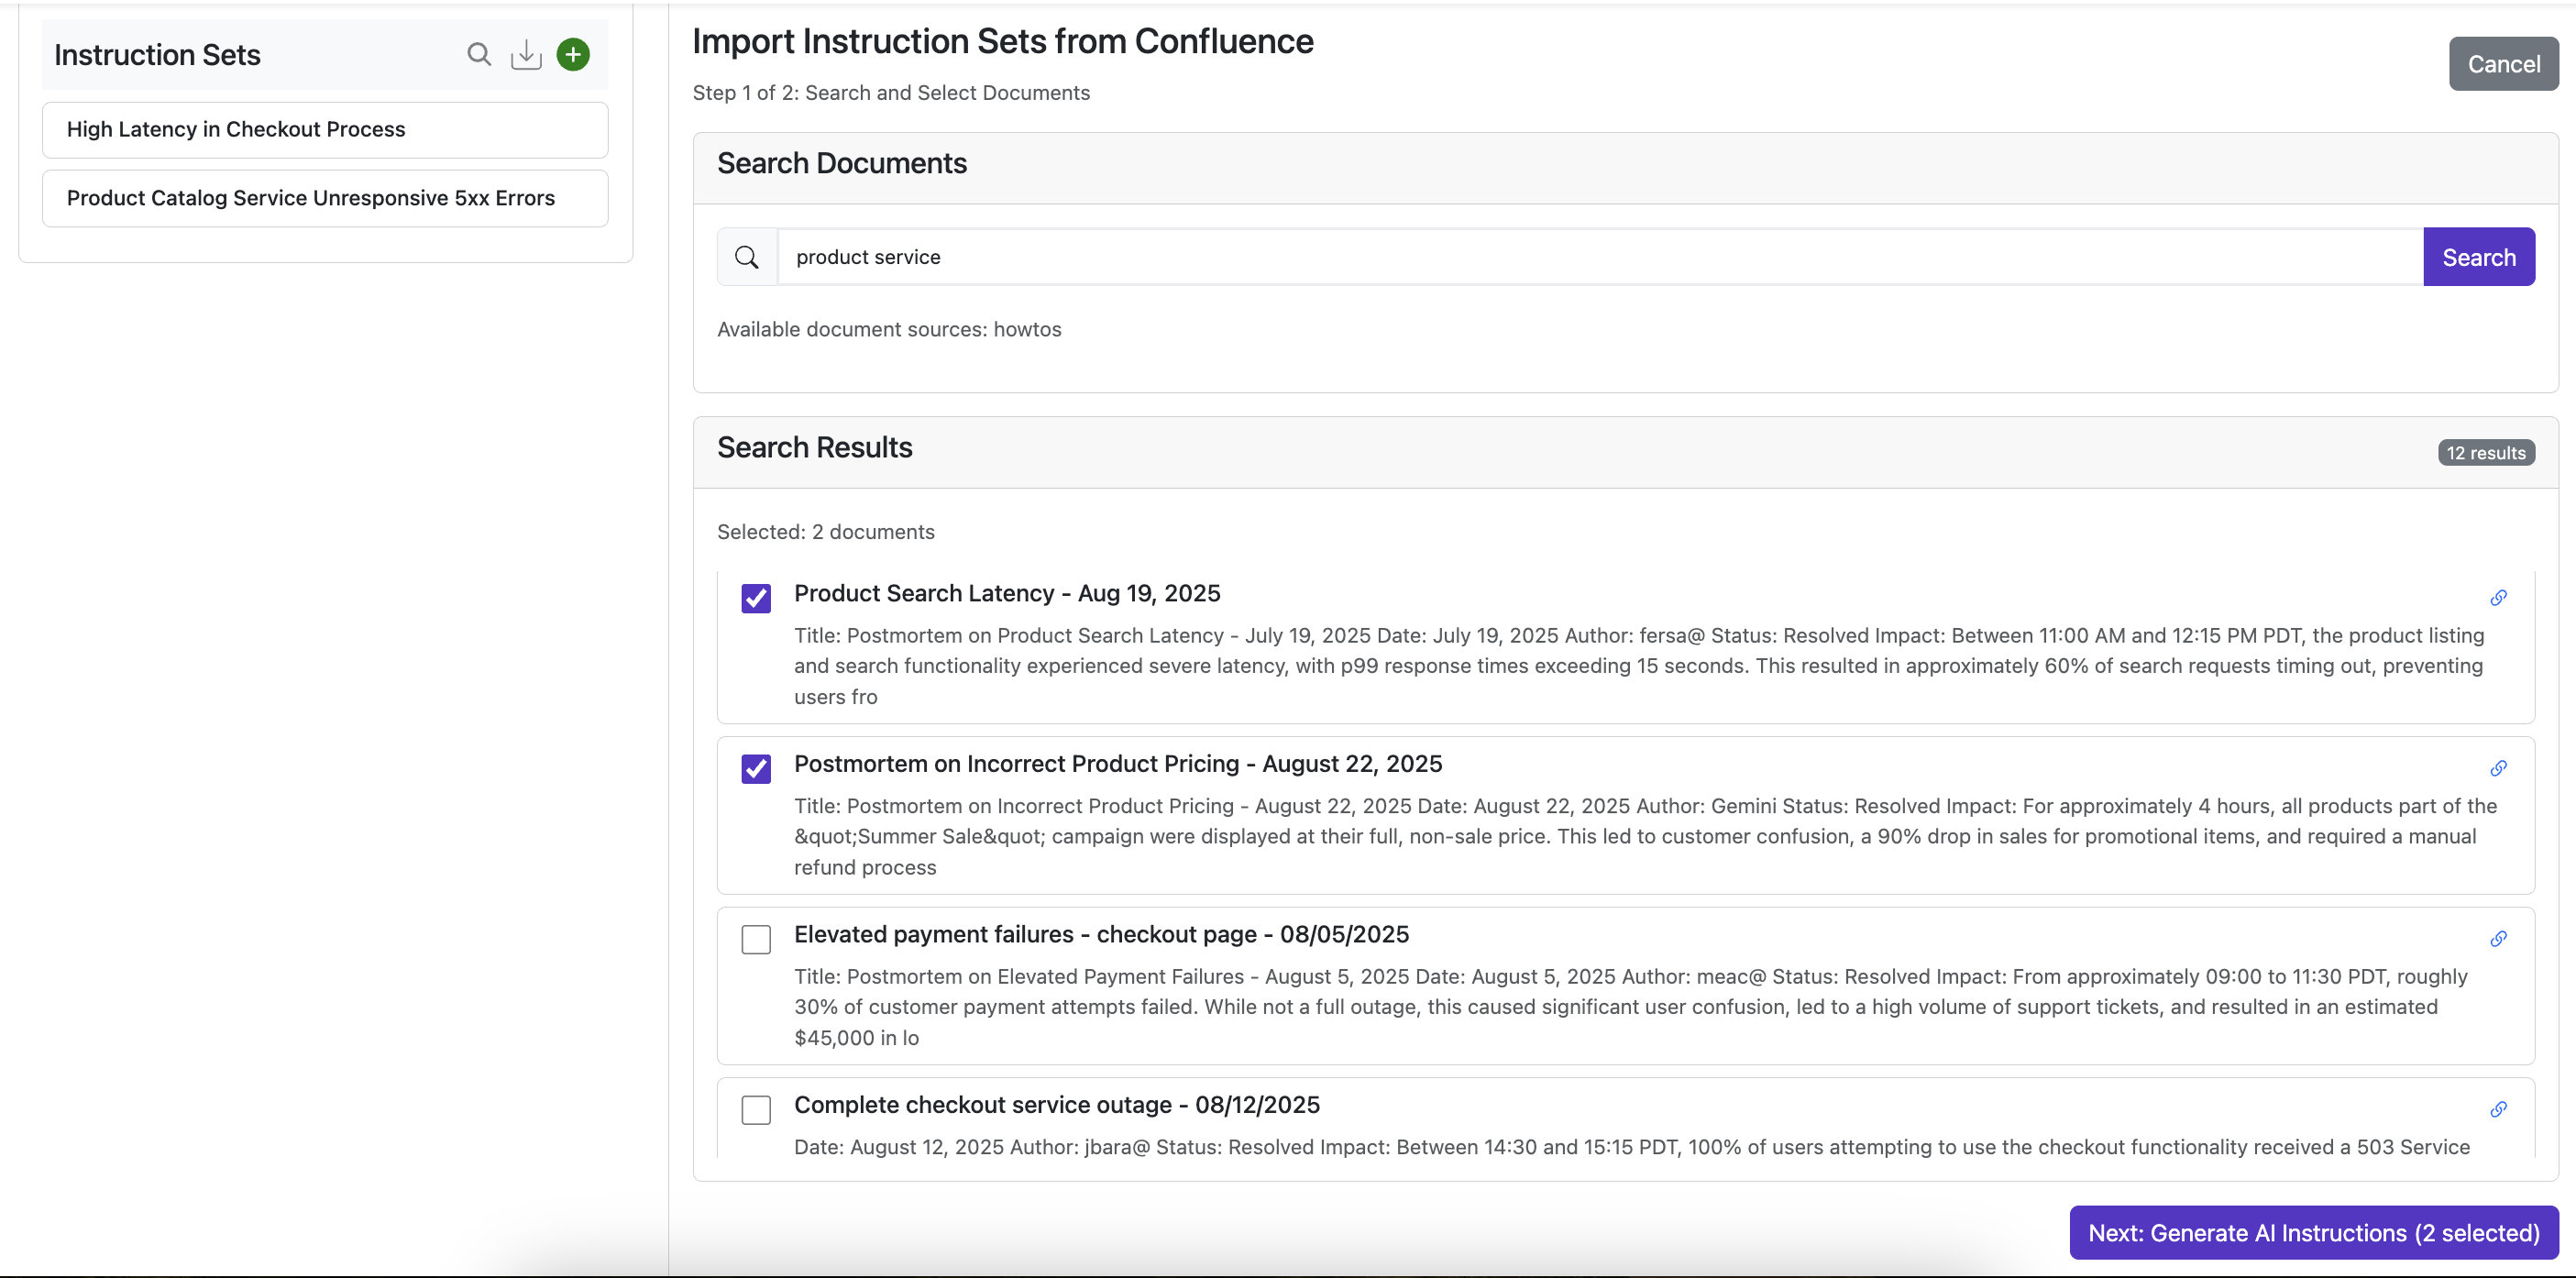
- Click on ‘Generate AI Instructions’ from the selected documents.
- Relvy AI will generate detailed instructions with executable queries from your documents for your review.
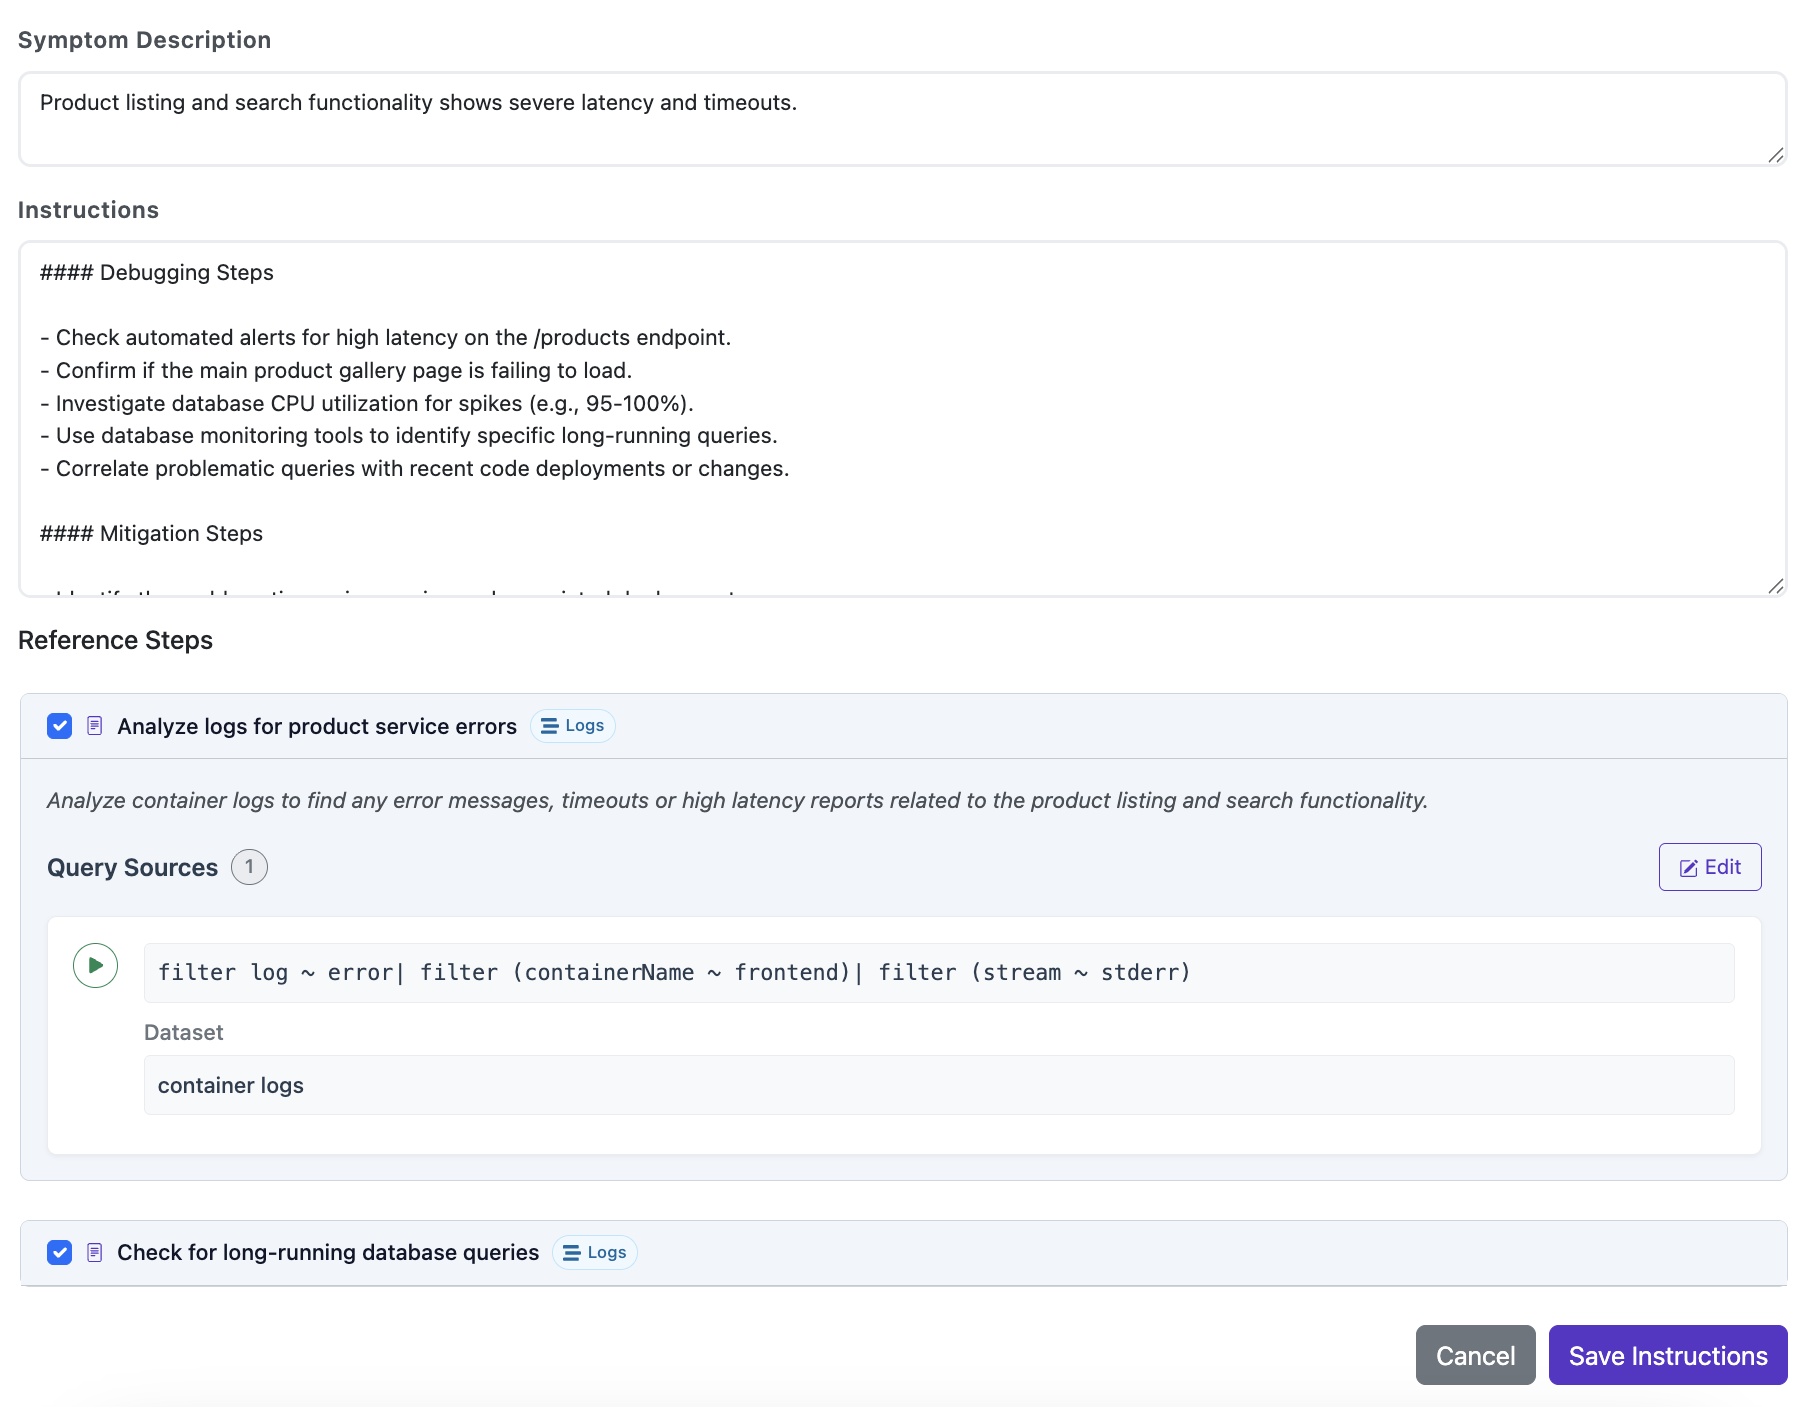
- Review generated instructions, edit and save the ones you like.
From Investigations
Relvy can save your investigation as an AI Instruction Set for easy reuse on similar future investigations. Steps- Once you are happy with the steps taken during an investigation, click on “Save as AI Instructions”.
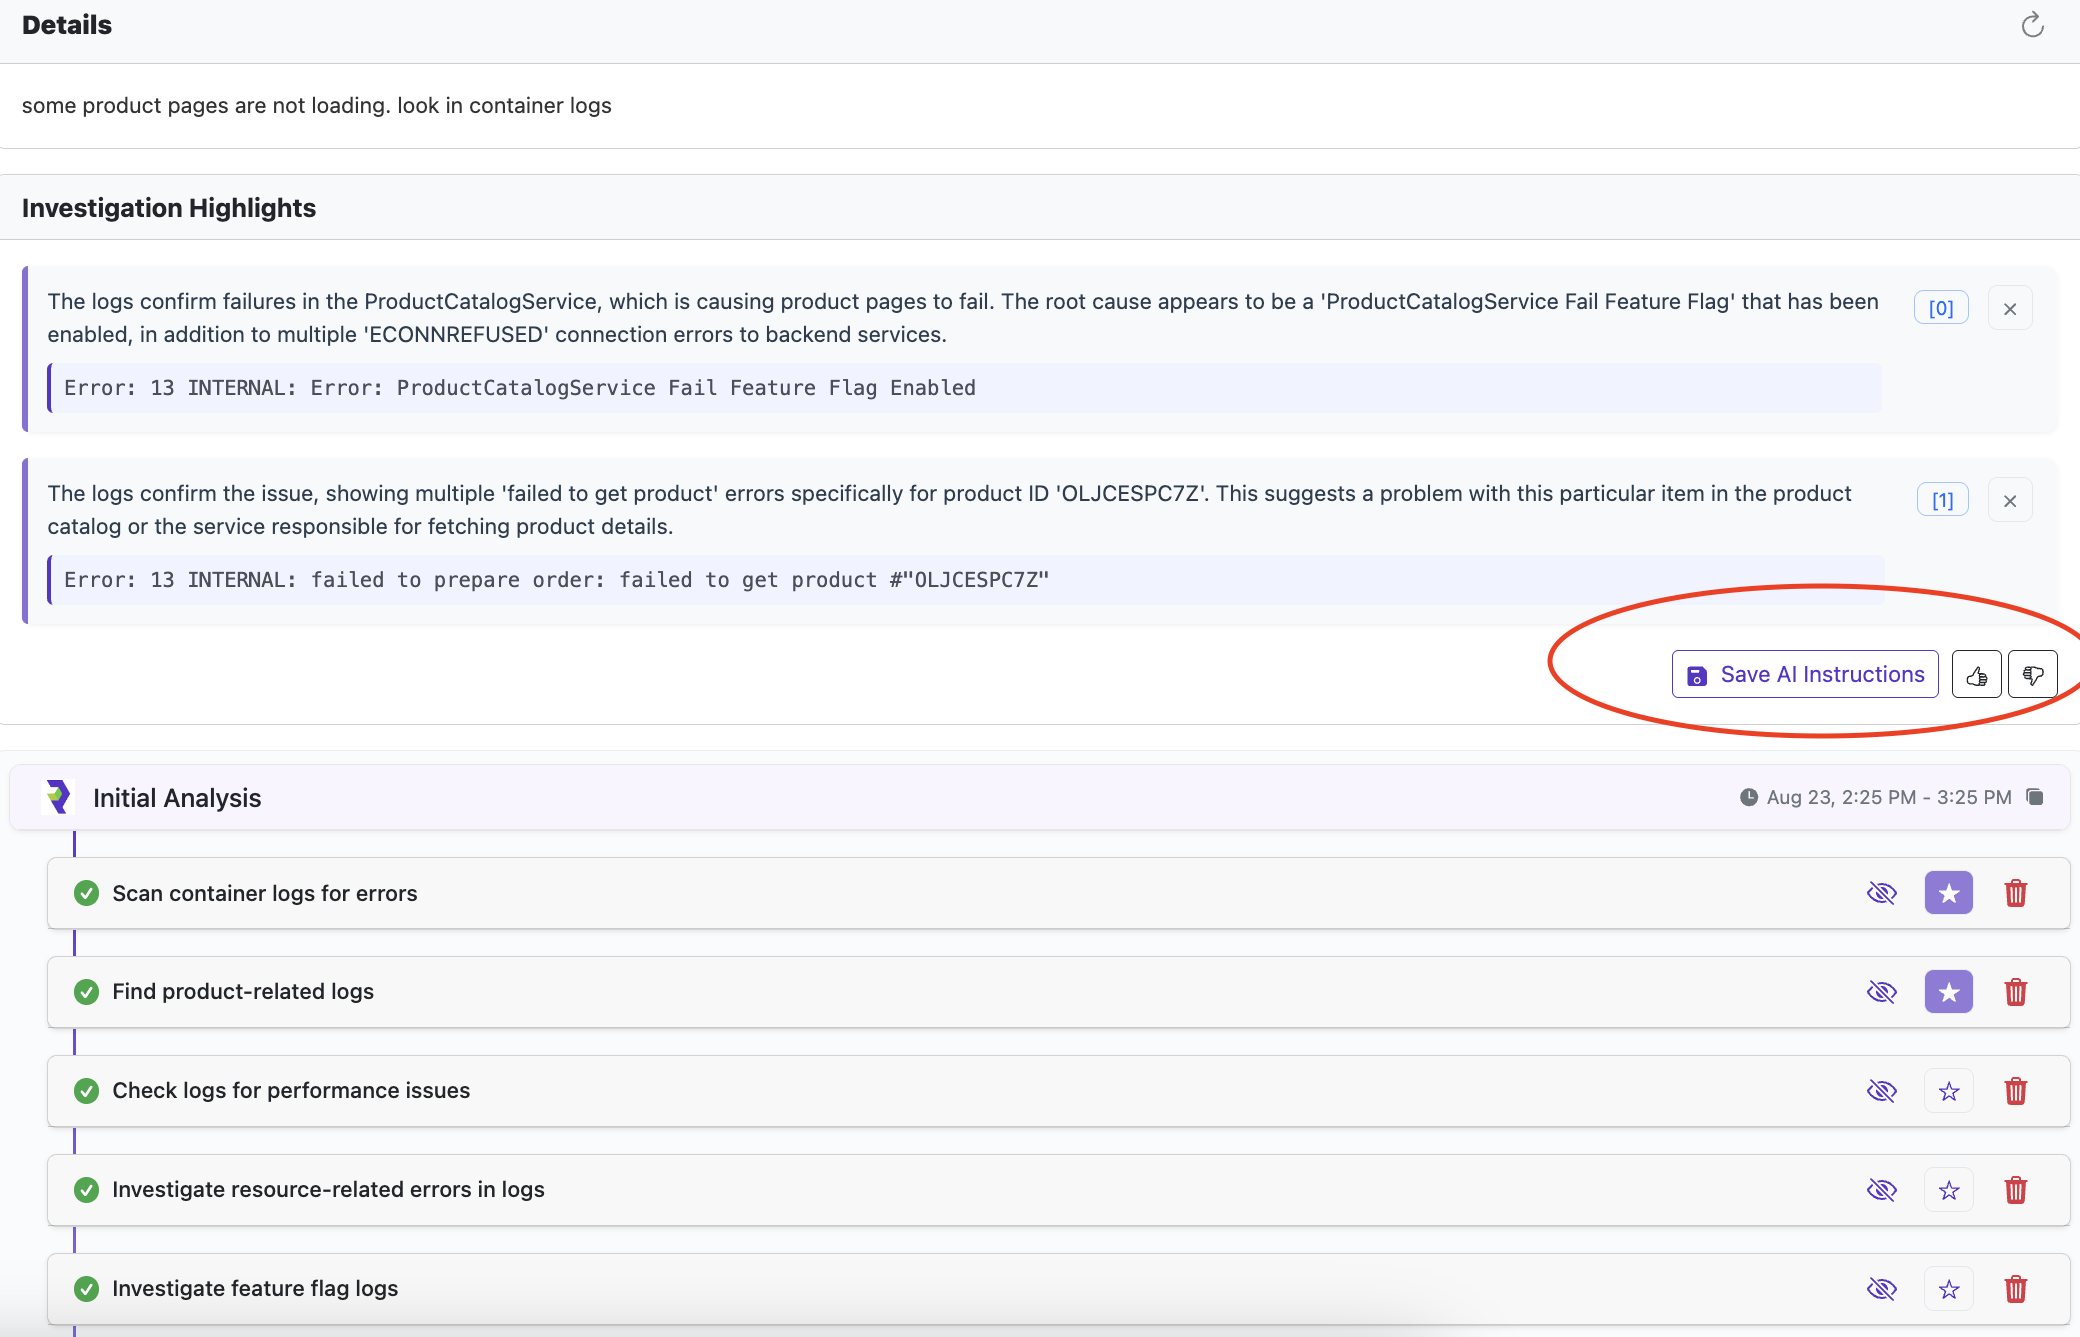
- Select any subset of steps that are relevant for future similar invesigations, and hit Save.
Example AI Instructions
Example 1: General Debugging Instructions
| Title | General Debugging Instructions |
| When to Use | When debugging any incident |
| Instructions | 1. Check RED metrics dashboard as a starting point for most investigations 2. For user facing issues, check frontend service logs and metrics 3. To check recent deployments, filter events by @source:kubernetes and look for pod restarts, scaling or service deployments 4. Check Runtime metrics dashboard for CPU/memory utilization 5. To locate traces from logs, use otel.trace_id and otel.span_id |
Example 2: Latency in Backend Services
| Title | Latency in Core APIs |
| When to Use | When alerts mention increased latency in APIs |
| Instructions | 1. Begin with the API service metrics dashboard 2. Compare current latency to 1h and 24h baselines 3. Check for saturation in DB or cache services connected to the API 4. Investigate traces for slow spans and associated service calls 5. Review logs for errors or warnings in the same time range |
Example 3: Debugging Kafka Issues
| Title | Debugging Kafka issues |
| When to Use | When debugging a kafka related alert |
| Instructions | 1. Look at the kafka dashboard for the appropriate topic / consumer group - identify specific affected partitions 2. Identify if any consumer pods are down 3. Check logs for consumer and producer services 4. For lag issues, check if this is because of traffic surges 5. Finally, check the kafka infra metrics dashboards for issues with kafka itself |
Example 4: Application Architecture Overview
| Title | Application and System Description |
| When to Use | When debugging all incidents |
| Instructions | This is an ecommerce application (Astronomy Shop). This is the list of critical services: - accounting - ad - cart - checkout - currency - frontend - payment - product-catalog - quote - recommendation - shipping |
6.5 Runbook Management
- Runbooks can be searched and filtered by tags.
- You can edit them anytime to evolve with your system.
Benefits of Configurable AI Planning
With AI Instructions:- You encode team knowledge into the AI, turning experience into automation.
- Investigations become standardized, repeatable, and transparent.
- New team members benefit from a guided process, and experts can continuously improve it.